Here's a post on a lesson I learned today:
"If you don't need XDebug, do not load it at all!
Just disabling the relevant parts in the .ini file does not really disable it - and might, depending on what you're running, hurt your performance a lot."
What's this about?
This article is nothing against XDebug, which is a great tool for php developers. It's a presentation of the facts and why it's better to not load XDebug at all, instead of just disabling it, when it's not needed.
The "Issue":
I am currently working on a project where I am using RabbitMQ in order to distribute workload from front-end PHP scripts to back-end PHP-CLI scripts using essentially some modified PHP RabbitMQ RPC Examples.
The example scripts have a lot of loops and many calls to functions and language constructs.
They also are mostly long running cli scripts. "Long running" meaning, it's not your everyday script collection that gets loaded and executed in order to build a web-page and is discarded after being active for a very small amount of time (milliseconds - seconds).
In the scenarios below there is one producer and one consumer script. The producer, produces a few thousand messages, and for each of those, the consumer script returns a message. The consumer script also acknowledges the reception of the messages.
I am using the latest PHPStorm IDE and its remote debugging functionality.
The debug-listener will attach to the first script called - in this case the "consumer", since it's the first script called.
The images below will clearly show the performance measured at the rabbitmq-server (namely, the throughput), under each scenario.
Quicklinks:
1a) Running the scripts with XDebug, remote debugging enabled and with the Debugger listening
1b) Decoupling the debugger from the script that we started in (1a)
2) Running the scripts with XDebug loaded - but disabled
3) Running the scripts with XDebug not loaded
Scenarios:
1a) Running with XDebug loaded, remote debugging enabled and with the Debugger listening:
XDebug ini settings:
zend_extension = "extensionpath\php_xdebug-2.2.3-5.5-vc11.dll"
xdebug.default_enable = 1
xdebug.remote_enable = 1
xdebug.profiler_enable = 0
xdebug.remote_autostart = 0
Image:
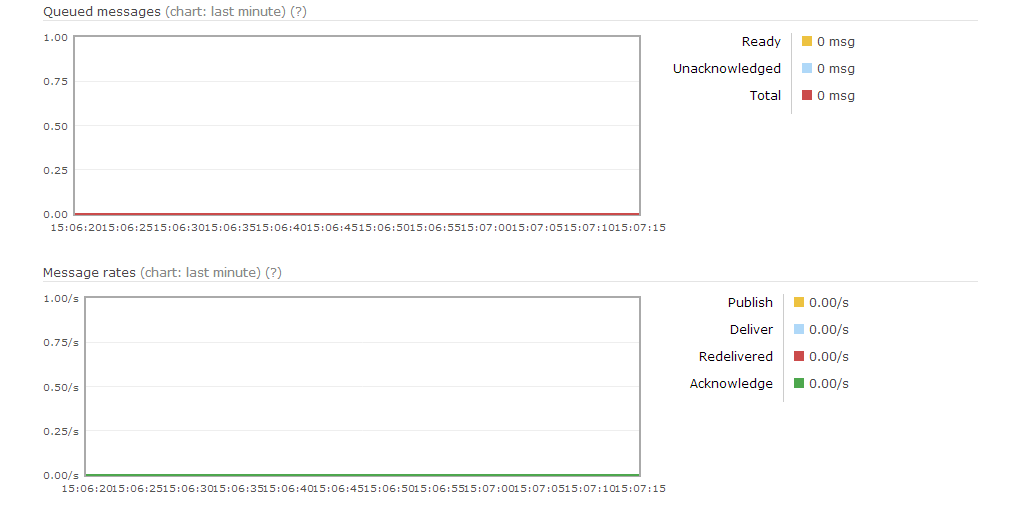
Analysis:
No messages are being processed at all. While this is odd, I assume that even though the debugger did not stop at any breakpoint, it seems that the amount of communication between XDebug and PHPStorm does not allow for the scripts to work correctly.
1b) Decoupling the debugger from the script that we started in(1a):
At this point we are just decoupling the PHPStorm Remote Debug-Listener and we are starting to see some message-flow.
XDebug ini settings: same as (1a)
zend_extension = "extensionpath\php_xdebug-2.2.3-5.5-vc11.dll"
xdebug.default_enable = 1
xdebug.remote_enable = 1
xdebug.profiler_enable = 0
xdebug.remote_autostart = 0
Image:
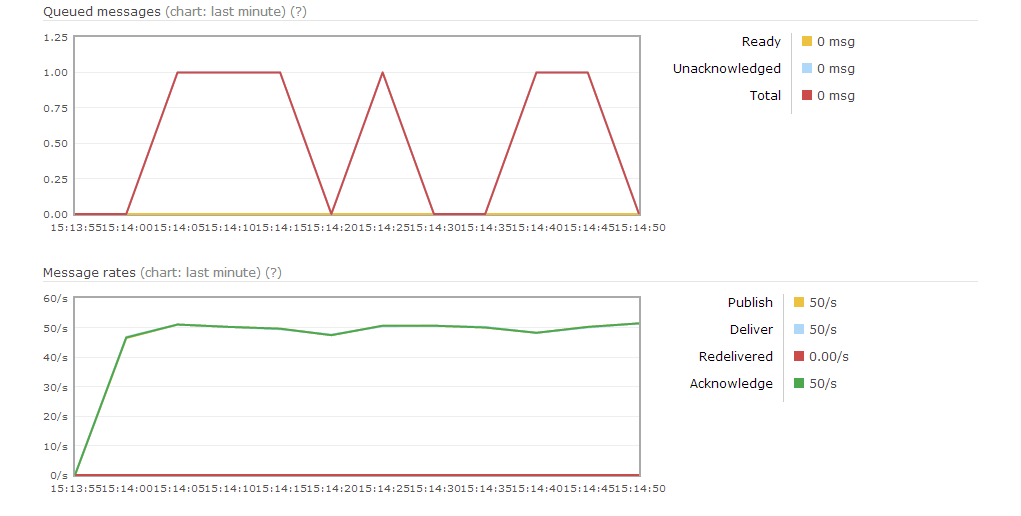
Analysis:
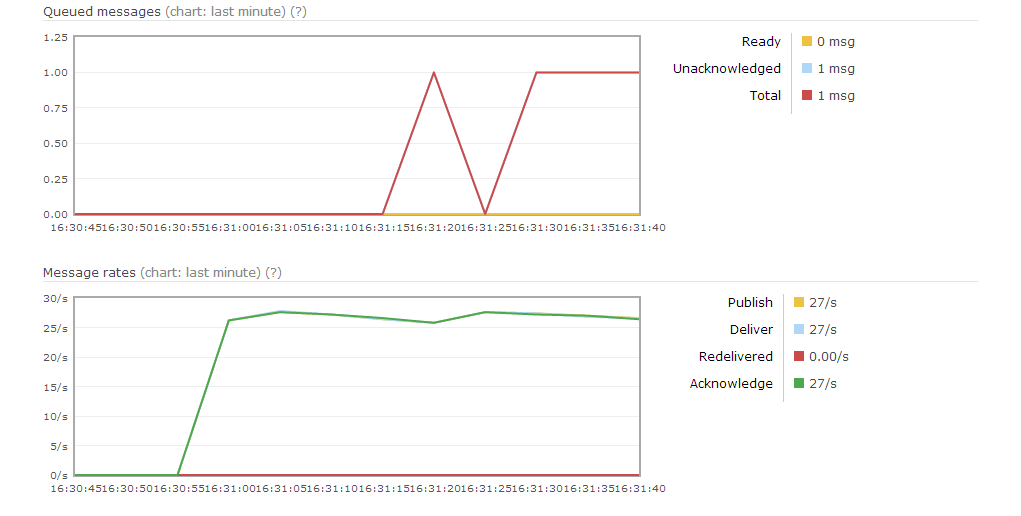
Having taken PHPStorm out of the picture, we now have 50 msg/s (out of a max of ~650 msg/s in these tests) being published and acknowledged. So, even without PHPStorm, XDebug seems to have a big impact on performance.
2) Running the scripts with XDebug loaded - but disabled:
XDebug ini settings:
zend_extension = "extensionpath\php_xdebug-2.2.3-5.5-vc11.dll"
xdebug.default_enable = 0
xdebug.remote_enable = 0
xdebug.profiler_enable = 0
xdebug.remote_autostart = 0
Image:
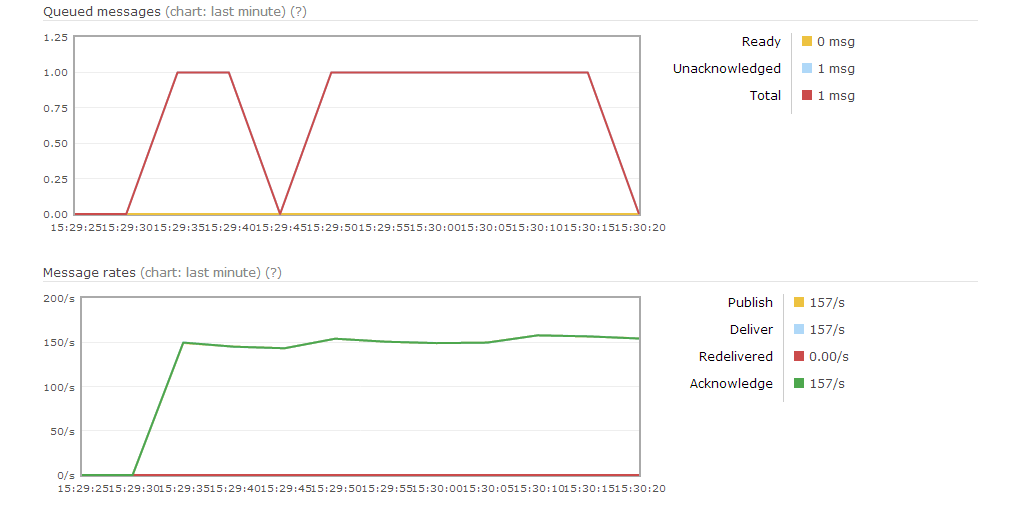
Analysis:
Here we have XDebug loaded, but all the relevant options disabled.
One would assume that XDebug being disabled, would give us the maximum performance of around 650 msg/s published and acknowledged, but this is not the case. We're still getting only 150 msgs/s.
So, with those specific scripts, the performance is about one fourth of what could be, when XDebug is loaded - but disabled.
3) Running the scripts with XDebug not loaded:
XDebug ini settings:
;zend_extension = "extensionpath\php_xdebug-2.2.3-5.5-vc11.dll"
xdebug.default_enable = 0
xdebug.remote_enable = 0
xdebug.profiler_enable = 0
xdebug.remote_autostart = 0
Image:
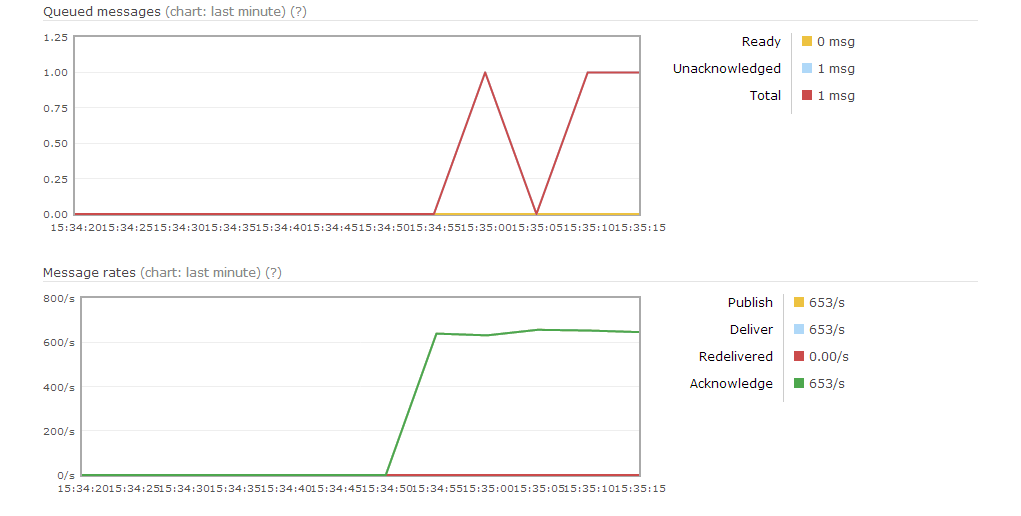
Analysis:
Finally, we reach the maximum throughput of around 650 msg/s for those tests, just by not loading the XDebug extension at all.
Conclusion:
XDebug will probably not hurt anyone's performance in debugging a normal web script, but it might give you massive performance issues in long running PHP scripts that constantly loop over functions, like the ones in this case.
So, when doing performance testing/optimizations, make sure XDebug is not loaded.
Oh, there's one more thing...
All of the above doesn't stop us from using XDebug for profiling our scripts when needed. The performance will be penalized extremely, but the profiling should mostly be accurate. Scripts like the ones used in this test, shouldn't be left running for too long, because the profile file can become quite large (391MB for about three and a half minutes profiling the consumer script). The performance, during the profiling of the scripts (both producer and consumer were profiled) was about 26 msgs/s.
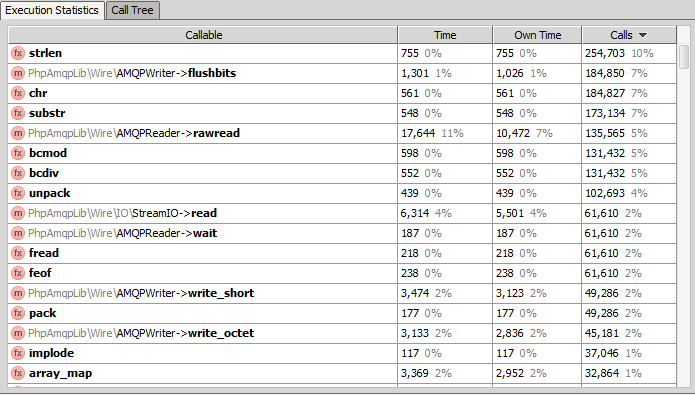
And here's an analysis image of the profiling result. It's sorted by calls, so you get the picture of how many calls were done in those three and a half minutes this script ran (notice the topmost call of 254,703 calls being only 10% of the total...).
This should explain the performance hit when using XDebug in those cases.
Tests where done using:
EasyPHP WAMP Stack 13.1 with PHP 5.5.0 on a Windows 7 x64 Machine ( i2600K / 16GB RAM / Hardware Raid )
EDIT: I have put the modified rpc-consumer.php and rpc-producer.php in this gist: https://gist.github.com/frankmayer/6268139, so there's not a lot to prepare for the tests. You might need to change the autoloader path in the producer/consumer though. The modifications are:
- introduced a 20000 messages loop in the producer
- remarked the fib calculations and just return whatever the producer sent, in order to have a clean profiling result